Scraping for Craft Beers
17 Jan 2017If you have read some of my posts in the past, you know by now that I enjoy a good craft beer. I decided to mix business with pleasure and write a tutorial about how to scrape a craft beer dataset from a website in Python.
This post is separated in two sections: scraping and tidying the data. In the first part, we’ll plan and write the code to collect a dataset from a website. In the second part, we’ll apply the “tidy data” principles to this freshly scraped dataset. At the end of this post, we’ll have a clean dataset of craft beers.
Web Scraping
A web scraper is a piece of code that will automatically load web pages and pull specific data for you. The web scraper will do a repetitive task that would otherwise be too long for you to manually do.
For example, we could code a web scraper that will pull a list of product names and their rating from an e-commerce website and write them in a CSV file.
Scraping a website is a great way to acquire a new dataset that would otherwise be unavailable.
A few rules on scraping
As Greg Reda pointed out a few years ago in his excellent web scraping tutorial, there are a few rules that you need to know about scraping:
- Respect the website terms & conditions.
- Don’t stress the servers. A scraper can make thousands of web page requests in a second. Make sure you don’t put too much pressure on the server.
- Your scraper code will break.Web pages change often. Your scraper code will be outdated soon.
Planning
The first step in building a scraper is the planning phase. Obviously, you want to decide what data that you want to pull and from which website.
In our case, we want to pull data from a website called CraftCans. This website lists 2692 craft canned beers. For this specific dataset, we wouldn’t need to build a scraper to pull the data. The way it’s laid out, we could easily copy and paste it into an Excel spreadsheet.
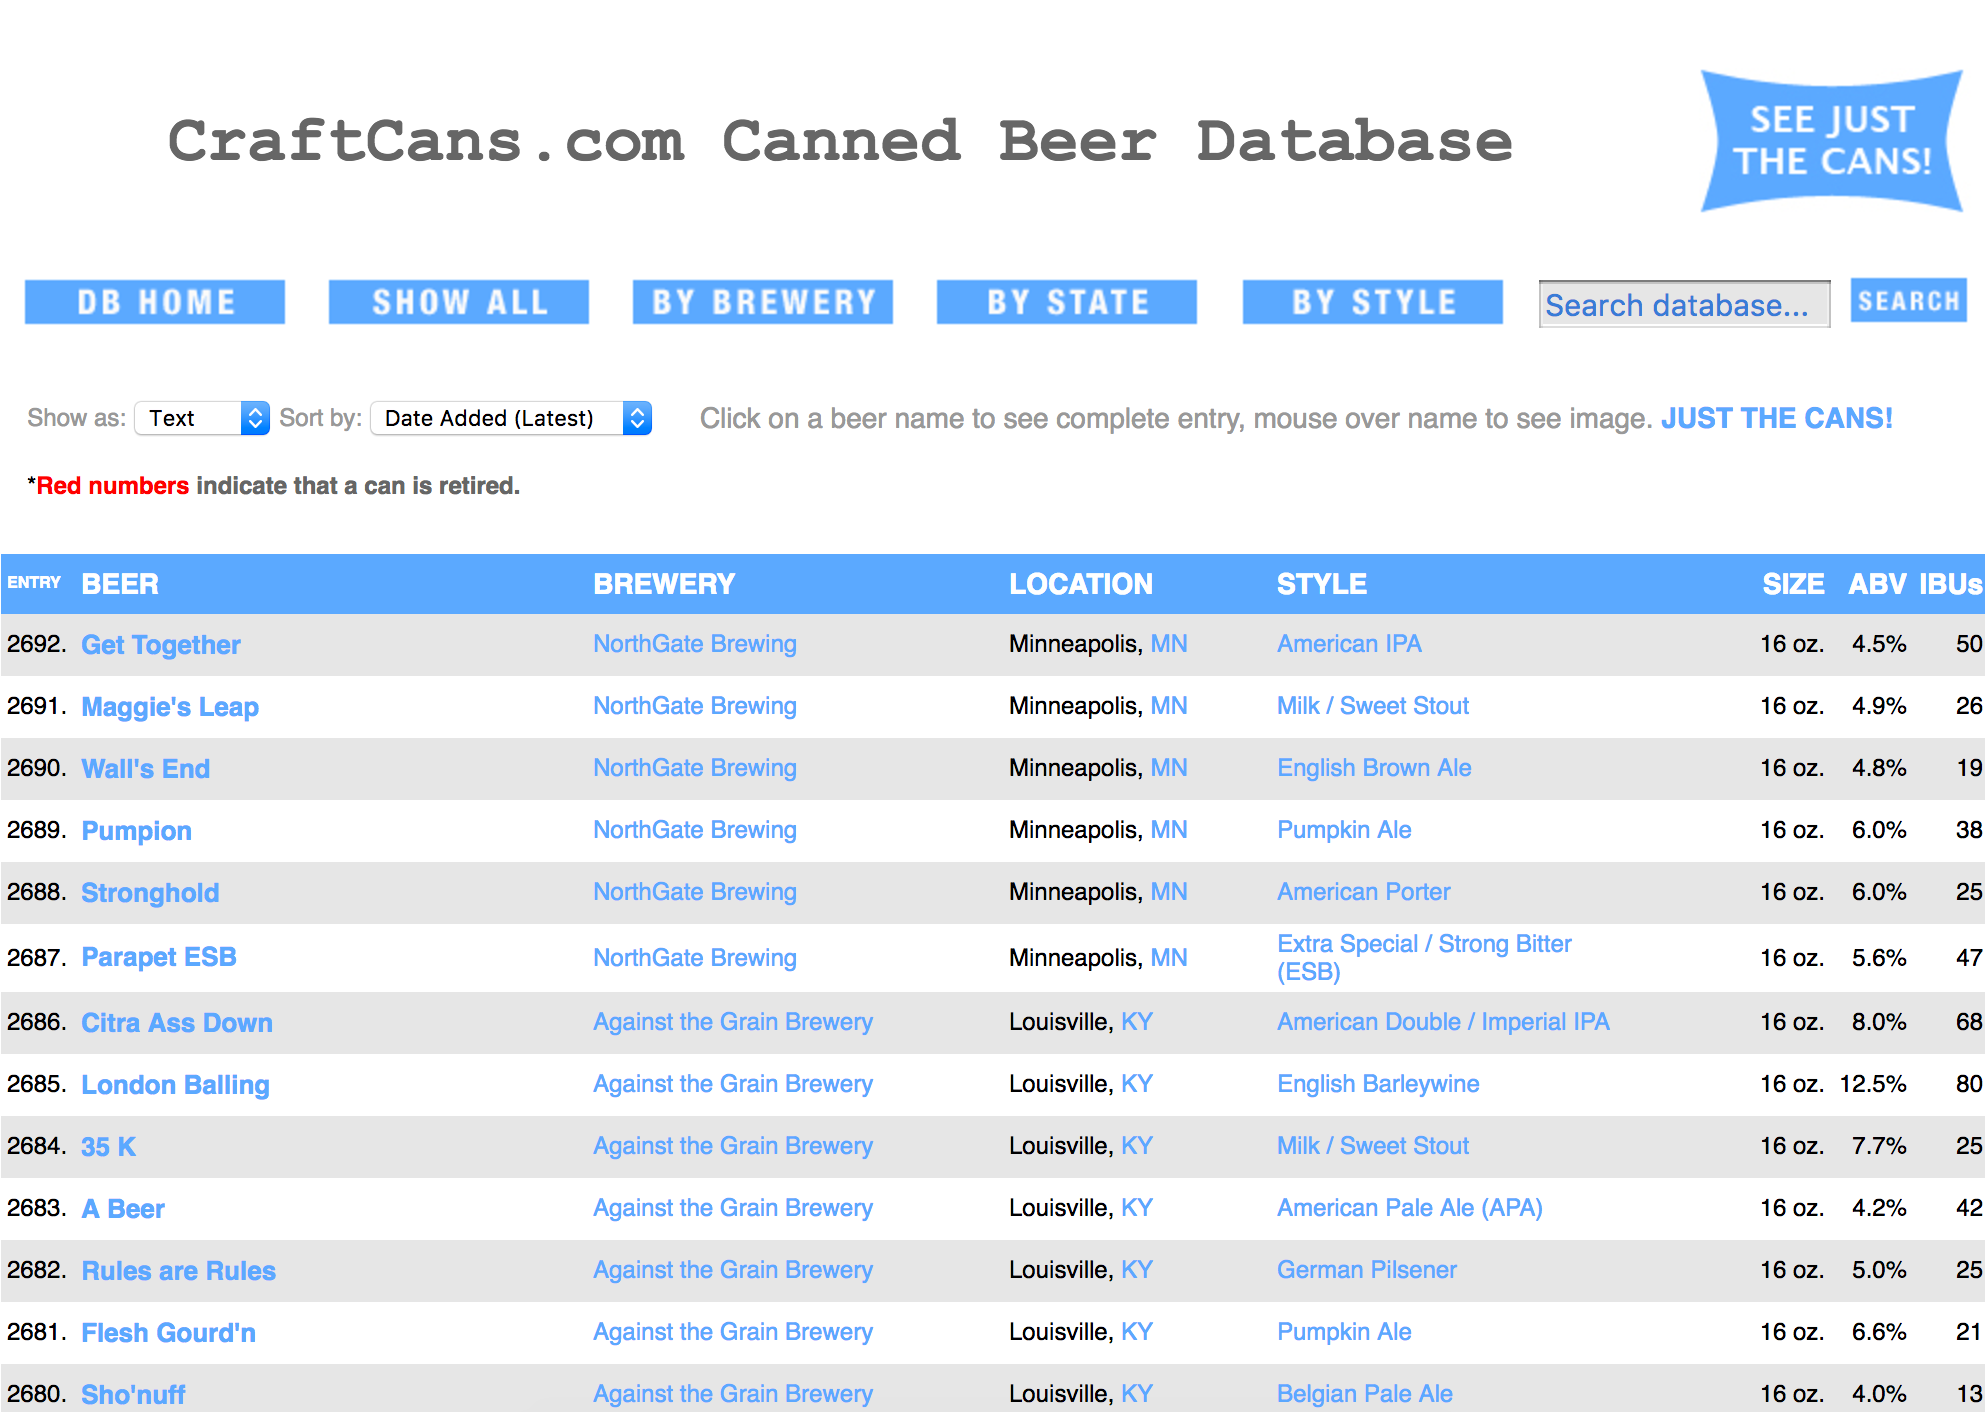
For each beer, the website presents some details:
- Name
- Style
- Size
- Alcohol by volume (ABV)
- IBU’s
- Brewer name
- Brewer location
Inspect the HTML
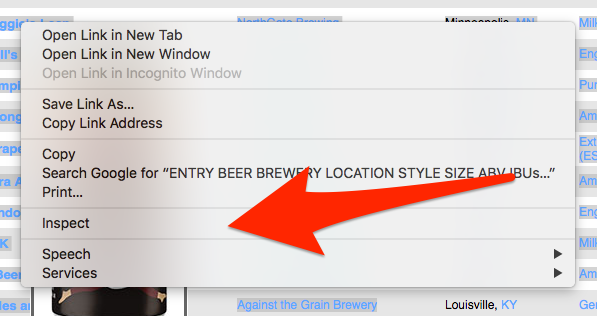
We’d like our scraper to pull all of this information for us. In order to give our scraper specific instructions, we need to look at the HTML code of CraftCans website. Most modern web browser offer a way to inspect the HTML source code of a web page by right click on the page.
On Google Chrome, you can right click on an element in a web page and the click on “Inspect” to see the HTML code.
Identify patterns
Looking at the HTML code on the main page, you can see that this big list of beer is in fact an HTML table. Each beer represents a row in this table. Generally, a repeating pattern, such as an HTML table, is ideal for web scraping because the logic is straightforward.
Libraries used
For this project, we’ll import four libraries.
from urllib.request import urlopen

from bs4 import BeautifulSoup
import pandas as pd
import re

# Python 3.5.2 :: Anaconda 4.2.0 (x86_64)
# pandas==0.18.1
# beautifulsoup4==4.5.1
urlopen
The first one urlopen will be used to request an HTML page on the web and return it’s content. That’s it.
BeautifulSoup4
The second one, BeautifulSoup4, is a library that makes it easy to navigate in an HTML document. For example, with this library you can easily select a table in an HTML document and iterate over its rows.
pandas
The third one is pandas. We will not use this library for the scraping part. We will use it for the tidying part. pandas is a library designed to facilitate data manipulation and analysis.
re for regular expressions
Finally, we’ll be using re which is part of the Python Standard Library. This lib provides regular expression matching operations. Regular expressions are ways to manipulate strings. For example, we can use regular expressions to list all of the numbers in a string.
Write the code
Challenges with the HTML
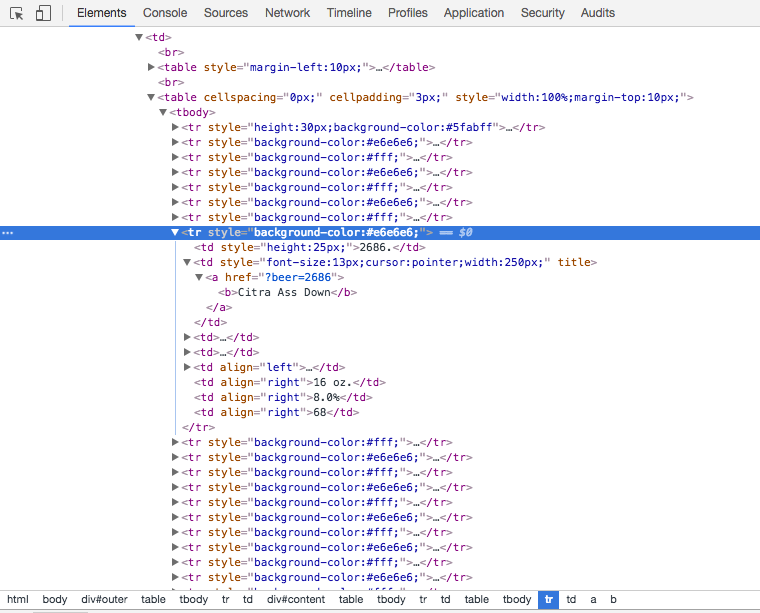
After some investigation on CraftCans web page, I realized there is no clean ways to scrape the CraftCans website.
The HTML structure of CraftCans is kind of old school. The whole layout of the page is in tables. This was a common practice in the past but now the layout is generally set with some CSS.
Furthermore, there are no class or identifiers on the HTML table or rows that contains the beer entries. Pointing the scraper to the specific table that we want is challenging without a clean HTML structure or identifiers.
Solution: List all table rows
The solution I found to scrape the website is most likely not the cleanest but it works.
Since there are no identifiers on the table that contains the data, I use BeautifulSoup4 findAll function to load all of the table rows tr present in the CraftCans page. This function returns an exhaustive list of table rows, whether or not they are from the table we want to scrape.
For each row, I run a test to determine whether or not it’s a row containing a beer entry or if it’s something else. The heuristic to determine if a row is a beer data entry is straightforward: the row needs to contain eight cells and the first cell must contain a valid numeric id.
# Determines if a table_row is a beer entry
def is_beer_entry(table_row):
    row_cells = table_row.findAll("td")
    beer_id = get_beer_id(row_cells[0].text)
    return ( len(row_cells) == 8 and beer_id )

# Return the beer entry numerical identifier from the "Entry" column.
def get_beer_id(cell_value):
    r = re.match("^(\d{1,4})\.$", cell_value)
    if r and len(r.groups()) == 1:
        beer_id = r.group(1)
        return int(beer_id)
    else:
        return None
Now that we have the functions to determine if a row is indeed a beer entry, we can now scrape the whole web page. We need to decide in which format we want to store the collected data from the website. I’d like to have a JSON document like this one for each beer entry in CraftCans.
Example Beer JSON Entry
{
    "id": 2692,
    "name": "Get Together",
    "brewery_name": "NorthGate Brewing",
    "brewery_location": "Minneapolis, MN",
    "style": "American IPA",
    "size": "16 oz.",
    "abv": "4.5%",
    "ibu": "50",
}
The reason I like to store the data in JSON document is because I can easily transform them into a pandas DataFrame.
def get_all_beers(html_soup):
    beers = []
    all_rows_in_html_page = html_soup.findAll("tr")
    for table_row in all_rows_in_html_page:
        if is_beer_entry(table_row):
            row_cells = table_row.findAll("td")
            beer_entry = {
                "id": get_beer_id(row_cells[0].text),
                "name": row_cells[1].text,
                "brewery_name": row_cells[2].text,
                "brewery_location": row_cells[3].text,
                "style": row_cells[4].text,
                "size": row_cells[5].text,
                "abv": row_cells[6].text,
                "ibu": row_cells[7].text
            }
            beers.append(beer_entry)
    return beers
Run the Scraper
Having our functions written, we can then request the CraftCans web page with urlopen and have our code take care of the rest.
html = urlopen("http://craftcans.com/db.php?search=all&sort=beerid&ord=desc&view=text")
html_soup = BeautifulSoup(html, 'html.parser')
beers_list = get_all_beers(html_soup)
With the list of beers returned by get_all_beers, we can easily create a new pandas DataFrame to conveniently visualize and manipulate our data.
df = pd.DataFrame(beers_list)
df.head(5)
Tidy up
In the scraping part, I didn’t bother to clean up the data. There are a few reasons for this. First, pandas is my tool of choice to manipulate the data. Secondly, I wanted to separate the concerns: scraping and cleaning.
In a previous post, I explained the concept of “tidy data”. This concept was initially presented by Hadley Wickham who describes a tidy dataset as one having the following attributes:
- Each variable forms a column and contains values
- Each observation forms a row
- Each type of observational unit forms a table
If you take a moment to look at the dataset we scraped so far, you will notice it’s messy. It does not conform to the properties of a “tidy dataset”. You will notice there are multiple observational units in the same table (beers and breweries), there are multiple variables in a single column (city and state), etc. In this section of the post, we’ll clean up the dataset.
| abv | brewery_location | brewery_name | ibus | id | name | size | style |
|---|---|---|---|---|---|---|---|
| 4.5% | Minneapolis, MN | NorthGate Brewing | 50 | 2692 | Get Together | 16 oz. | American IPA |
| 4.9% | Minneapolis, MN | NorthGate Brewing | 26 | 2691 | Maggie's Leap | 16 oz. | Milk / Sweet Stout |
| 4.8% | Minneapolis, MN | NorthGate Brewing | 19 | 2690 | Wall's End | 16 oz. | English Brown Ale |
| 6.0% | Minneapolis, MN | NorthGate Brewing | 38 | 2689 | Pumpion | 16 oz. | Pumpkin Ale |
| ... | ... | ... | ... | ... | ... | ... | ... |
Beers & Breweries: Two Observational Units
The most flagrant problem with the scraped dataset is that there are multiple observation units in the table: beers and breweries. The solution for this is to create two separate dataset.
Breweries
The breweries dataset is straightforward to create. We simply select the relevant columns in our scraped dataset, remove the duplicates and then reset the index. The reason we reset the index is to assign a unique identifier to each brewery. This will be useful when we’ll create the beer dataset because we’ll be able to associate each beer with a `brewery_id.
breweries = df[["brewery_location", "brewery_name"]]
breweries = breweries.drop_duplicates().reset_index(drop=True)
breweries["id"] = breweries.index
breweries.head(5)| brewery_location | brewery_name | id | |
|---|---|---|---|
| 0 | Minneapolis, MN | NorthGate Brewing | 0 |
| 1 | Louisville, KY | Against the Grain Brewery | 1 |
| 2 | Framingham, MA | Jack's Abby Craft Lagers | 2 |
| 3 | San Diego, CA | Mike Hess Brewing Company | 3 |
| 4 | San Francisco, CA | Fort Point Beer Company | 4 |
Beers
For the beers dataset, we want to replace all of the repetitive brewery information, such as the location and name, with a brewery_id. Previously, we created a dataset of breweries where each brewery has a unique id. It’s now time to use this identifier.
To match this brewery_id with the appropriate beer, we use the merge function in pandas. This function is similar to a join in SQL. In this function, we pass both the scraped dataset and the breweries dataset as function parameters. We also specify that we want to join both of these datasets on the brewery_name and brewery_location. This will result in a new DataFrame.
beers = pd.merge(df,
                 breweries,
                 left_on=["brewery_name", "brewery_location"],
                 right_on=["brewery_name", "brewery_location"],
                 sort=True,
                 suffixes=('_beer', '_brewery'))
beers = beers[["abv", "ibu", "id_beer",
               "name", "size", "style", "id_brewery"]]
beers_columns_rename = {
    "id_beer": "id",
    "id_brewery": "brewery_id"
}
beers.rename(inplace=True, columns=beers_columns_rename)
beers.head(5)| abv | ibu | id | name | style | brewery_id | ounces | |
|---|---|---|---|---|---|---|---|
| 0 | 0.050 | NaN | 1436 | Pub Beer | American Pale Lager | 408 | 12.0 |
| 1 | 0.066 | NaN | 2265 | Devil's Cup | American Pale Ale (APA) | 177 | 12.0 |
| 2 | 0.071 | NaN | 2264 | Rise of the Phoenix | American IPA | 177 | 12.0 |
| 3 | 0.090 | NaN | 2263 | Sinister | American Double / Imperial IPA | 177 | 12.0 |
| 4 | 0.075 | NaN | 2262 | Sex and Candy | American IPA | 177 | 12.0 |
City and State: Two Variables
In the breweries dataset, the brewery_location column contains two variables: the city and the state in which the brewery is located in. To respect the tidy principles, we want to isolate each variable in a single column.
Technically, separating those two variables can be accomplished using the split function. This function will split the string it’s called on every time it encounters the delimiter passed as a parameter. In this case, our delimiter is a comma. The function will split the string every time it encounters this comma. The value returned by the function is a list of strings.
To run the split function on each value of the brewery_location Series, we use the apply function. This function will repetitively run code on each value of a Series. In this case, the code we run is a lamba. This anonymous function splits the brweery_location string and returns the appropriate value, the city or state, in the list of returned strings.
breweries["city"] = breweries["brewery_location"].apply(
    lambda location: location.split(",")[0])
breweries["state"] = breweries["brewery_location"].apply(
    lambda location: location.split(",")[1])
breweries = breweries[["brewery_name", "city", "state"]]
breweries.rename(inplace=True, columns={"brewery_name": "name"})| name | city | state | id | |
|---|---|---|---|---|
| 0 | NorthGate Brewing | Minneapolis | MN | 0 |
| 1 | Against the Grain Brewery | Louisville | KY | 1 |
| 2 | Jack's Abby Craft Lagers | Framingham | MA | 2 |
| 3 | Mike Hess Brewing Company | San Diego | CA | 3 |
| 4 | Fort Point Beer Company | San Francisco | CA | 4 |
A few examples of strings to numerical values
The abv and ibu should be numerical values but they contain some letters. The abv column, which represents the alcohol by volume, is stored as a string with a “%” instead of a floating number between 0 and 1. Secondly, the ibu values are stored as strings while it should be integers. Some values are numbers while some others are a string “N/A”.
To fix this, I’ll apply some custom functions I created to clean up the data. You’ll notice that I am using try and except. The reason I am doing this is that I know my code will fail when it will encounter a string with letters. Therefore, if it fails due to ValueError, I return None. In the DataFrame, None will be transformed to NaN which indicates missing data.
def string_pct_to_float(value):
    stripped = str(value).strip('%')
    try:
        return float(stripped)/100
    except ValueError:
        return None

beers["abv"] = beers["abv"].apply(string_pct_to_float)

def string_to_int(value):
    try:
        return int(value)
    except ValueError:
        return None

beers["ibu"] = beers["ibu"].apply(string_to_int)
Size to Ounces: Strip out the measurement unit
Another problem with our dataset is that the size column contains a mix of numerical values and letters. The letters are used to indicate the measurement unit.
As I skimmed through the size column, I noticed the way the measurement unit was written was not consistent. Sometimes ounce was spelled oz., ounce, OZ., etc. In order to list all of the possible values we could be dealing with, I transformed the size column into a set and printed it. A set is a list that contains only unique values.
for possible_value in set(beers["size"].tolist()):
    print(possible_value)

#=> 16 oz.
#=> 12 & 16 oz.
#=> 12 oz
#=> 19.2 oz.
#=> 16 oz
#=> 12 ounce
#=> 12 OZ.
#=> 16.9 oz.
#=> 12 oz.
#=> 24 oz.
#=> 32 oz.
#=> 12 oz. Slimline
#=> 19.2
#=> 8.4 oz.
#=> 24 oz. "Silo Can"
#=> 16 oz. Alumi-Tek®
#=> 16 oz. Alumi-Tek®
#=> 12 oz.
Now that we know the set of possible values we can be dealing with, we can write some code to parse the string and transform it into a numerical value. To do this, I used a regular expression that matches the first number encountered.
def extract_ounces(value):
    stripped = value.strip("oz")
    match = re.match("(\d{1,2}\.*\d*)", value)
    if match:
        return float(match.group(0))
    else:
        return None

beers["ounces"] = beers["size"].apply(extract_ounces)
del beers["size"]
beers.head(5)| abv | ibu | id | name | style | brewery_id | ounces | |
|---|---|---|---|---|---|---|---|
| 0 | 0.050 | N/A | 1436 | Pub Beer | American Pale Lager | 408 | 12.0 |
| 1 | 0.066 | N/A | 2265 | Devil's Cup | American Pale Ale (APA) | 177 | 12.0 |
| 2 | 0.071 | N/A | 2264 | Rise of the Phoenix | American IPA | 177 | 12.0 |
| 3 | 0.090 | N/A | 2263 | Sinister | American Double / Imperial IPA | 177 | 12.0 |
| 4 | 0.075 | N/A | 2262 | Sex and Candy | American IPA | 177 | 12.0 |
Ready for exploration
We now have two clean datasets: beers and breweries. Each column has been cleaned up to respect the tidy principles. The code and the data for this post is available here on Github. We are now ready to start exploring those datasets.